At a glance
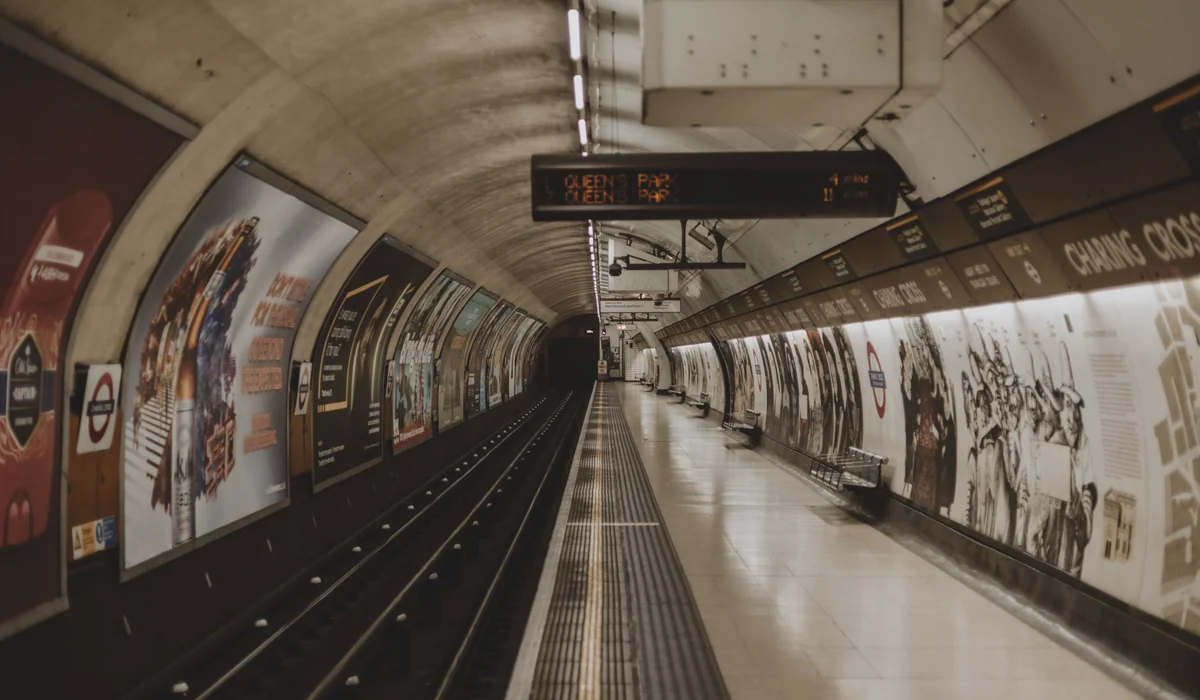
- In February 2014, 171 of London's 270 Tube stations closed for at least part of a two-day strike, pushing many regular commuters off their usual route.
- A week later, habitual commuters who had been pushed off were up to 5.4 percentage points more likely to be on a different route: roughly one in twenty.
- Most went back. The authors found search costs unlikely to explain the gap and point to poor information about alternatives, partly from a distorted Tube map.
In this essay
Your route to work was settled years ago, and it feels settled for good reason. You have ridden it hundreds of times. You know which carriage lines up with the exit and which escalator is out of order half the year. If a faster way existed, wouldn’t all those mornings have found it by now? In February 2014, a strike on the London Underground put that belief to a test for thousands of riders at once. Stations closed, and regulars had to improvise. When the gates reopened, most went straight back to their old journeys. A small group did not. Why would anyone keep a route they only tried because a strike forced them onto it, and what does that say about the routines you have never had reason to question?
The short answer: a map, and a question asked once
For the riders who switched, the old route had probably never faced a fair comparison. Repetition settles the question of how to get somewhere once, and then stops asking it. The economists who studied the strike read the evidence as a problem of information: commuters did not know enough about their alternatives to see that one might be better.
London makes the problem sharper in one specific way. If you have ever planned a trip from the Tube map, you were reading a diagram, not a scale drawing. Work cited in the study found a correlation of only 0.22 between distances on the map and distances on the ground. Covent Garden and Leicester Square are separate stations on the map, yet they are about 260 metres apart. Plan from the map, and a route that looks shorter can easily take longer.
Put those together and the switchers make sense: they were working from a picture of the network that their daily ride never had to correct. Your own sense of the best way to work was likely formed the same way, early and once, from whatever you knew then.
Inside 18,113 Oyster cards
That reading comes from economists Larcom, Rauch and Willems, who worked from anonymised Oyster card records of travel on London’s public transport from 19 January to 15 February 2014. On the busiest day in that window, the data held 19,301,730 entries. The paper was later published in the Quarterly Journal of Economics; the figures here come from the 2015 working paper.
The strike itself was a protest against plans to close all 278 Underground ticket offices. The RMT union called it for 48 hours from the Tuesday evening, and the heavy disruption fell on 5 and 6 February. What made it useful to researchers was that it was uneven. In all, 171 of the network’s 270 stations closed for at least part of the strike, while the rest stayed open. That split produced two groups of similar commuters: those whose usual journey was blocked and those whose journey was not.
The researchers kept only strict regulars: 18,113 card IDs that rode the Tube between 7am and 10am on all 18 non-strike working days. Within that group were 6,946 people who made the identical journey on all 10 working days before the strike. The authors call this definition strict and expect it to understate the effect. Then they looked at one ordinary day, Friday 14 February, a week after every station had reopened.
Among those habitual riders, the ones pushed off their route were more likely to be making a different commute that Friday. The gap was between 1.2 and 5.4 percentage points, depending on how “pushed off” is defined, and the authors believe the true figure sits near 5.4. That is the source of the “about one in twenty.” It describes a difference between groups of regular commuters, not a share of all Londoners.
The authors also tested the obvious objection, that trying a new route is simply too much hassle. For search costs to explain the behaviour, their model says, trying the best untried route for a single day would have to cost a commuter more than £380. They call that implausibly high. Search costs alone, they conclude, are unlikely to explain why people kept to their old journeys.
Those habitual riders had made the same journey ten mornings running. For the few who switched, those ten mornings were a single decision, made once and then repeated without ever meeting a rival.
What the evidence doesn’t show
Start with the other 19 in 20. Most riders forced onto a new route went back to the old one, and that result matters as much as the headline. For most of them, the old journey was presumably good enough already, or the difference was too small to change anything. A routine that survives a real test has earned its place, and you can keep it with a clear conscience.
The headline number is also softer than it sounds. The 5.4-point estimate counts anyone who left their usual journey during the strike as “treated,” and some of those detours may have had nothing to do with closed stations. Other definitions give 1.2 to 2.8 points. Later in the paper, the authors themselves round the result loosely to “about 5%” of treated commuters.
Persistence was observed for only one day. The data end on 15 February, so nobody followed these riders for months. Any long-run benefit is a calculation built on assumptions, and the calculation below should be read that way.
Scope matters too. These were morning Tube regulars with Oyster cards, in one city, during one two-day event. Even the map explanation is only partly supported: the link with map distortion was significant for the station where people got on, but not for where they got off. And the authors do not argue for disruption. Tens of thousands of people lost time that week, and the study cannot tell you which of your own habits are hiding something better.
Twenty seconds, repeated for years
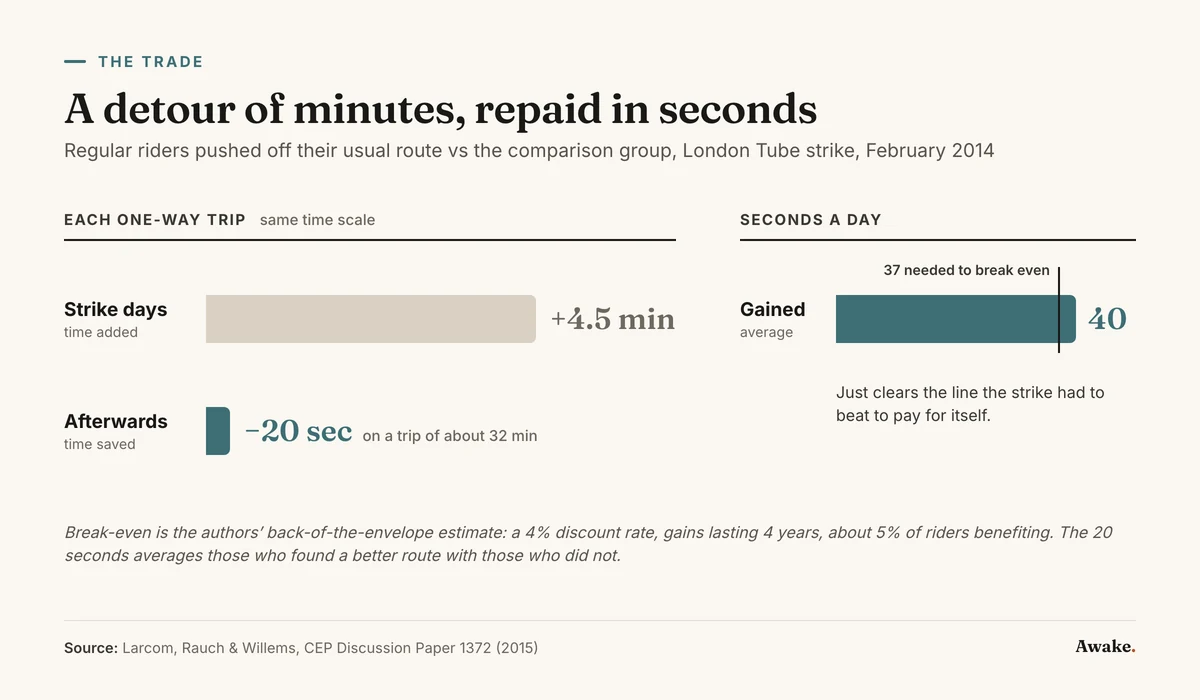
The time lost that week shows up in the data. Riders who left their usual route spent an average of 4.5 minutes longer on each one-way trip on strike days. Afterwards, the same group cut its journey times by about 1% more than the comparison group, roughly 20 seconds on a one-way commute of about 32 minutes. That average blends the few who found something better with the many who did not.
On its own, 20 seconds barely registers on your morning. The authors ran a conservative calculation anyway, assuming a 4% discount rate, gains lasting 4 years and about 5% of riders benefiting. On those terms, the average gain of 40 seconds a day cleared the 37 seconds a day the beneficiaries needed for the strike to make up for the time it cost. They call it back-of-the-envelope arithmetic. Its shape still holds: a short, unpleasant detour, repaid slowly through ordinary mornings.
Your own routines run on the same arithmetic. The coffee order, the gym slot, the hour you open email, the supermarket you drive past two others to reach. Each was settled once and has been repeated ever since. Most would probably survive a test. Which of them has ever faced a rival?
How we spend our days is, of course, how we spend our lives.
A small experiment
Choose one routine you have repeated so often you could do it half asleep. The commute counts, but so does the weekly shop or the first thing you do at your desk.
Then close the station on paper. What would you do if the usual way were simply unavailable tomorrow? Write down the alternative you would be forced into, ideally the one you have always assumed was worse without ever checking.
Tomorrow, take that alternative once. Note one thing when you arrive: the time it took, what it cost, or how you felt walking in. Set it beside the same note for your usual way.
The likeliest result is that your old routine wins, as it did for roughly 19 in 20 of those London regulars. Then you go back to it knowing it beat something. If it loses, you will have done on purpose what the strike did by accident for a small group of commuters in February 2014. You will have found a better route that ten identical mornings had kept out of sight.
A routine repeated for years was often chosen once. Before calling it the best option, set it against one real alternative.