
At a glance
- A 1997 study found NYC cabdrivers' hours tended to fall when hourly pay was higher, which the authors read as deciding 'one day at a time.'
- Later, larger data — full NYC trip records and a Boston Uber experiment — generally found drivers working more when pay was higher; a within-day pull from recent earnings may still show up.
- The time frame you judge money by — a day, a paycheck, a year — can change what counts as 'enough.'
In this essay
Picture a rainy afternoon in Manhattan. Every cab is full, fares come back to back, and by five o’clock a driver has already made what a slow day usually pays. Should that driver keep going, or head home?
Economists have argued over that question for more than two decades. Most of us face a smaller version of it all the time. A server counts tips after a busy lunch. A freelancer lands a big invoice on a Monday. You open the banking app on payday and feel rich until Thursday. Each time, one short window decides whether things feel good or bad. That feeling then decides what you do next.
Read to the end and you’ll see how the time frame you use to judge money — a day, a paycheck, a year — can quietly shape how much you work, earn, and spend.
The size of the window
Think of your bathroom scale. Weigh yourself every morning and the number jumps around with water, salt, and last night’s dinner. Look at the monthly average and a steadier line appears. Same body, different window, different story.
Money works the same way. The window you choose decides what counts as a good result. What counts as good then decides your next move.
Standard economic models say that if you can set your own hours, you should work more when pay is high and rest when it is low. If a busy day is when each hour pays best, the logical move across a week is to drive long on good days and short on slow ones.
Now judge each day on its own. Suppose a day feels finished once it hits a certain amount. Then a good day ends early and a slow day drags on. You end up working the most hours exactly when each hour is worth the least. Sounds too odd to be real? A famous study found a pattern that looked a lot like it.
What the cab data said, then said again
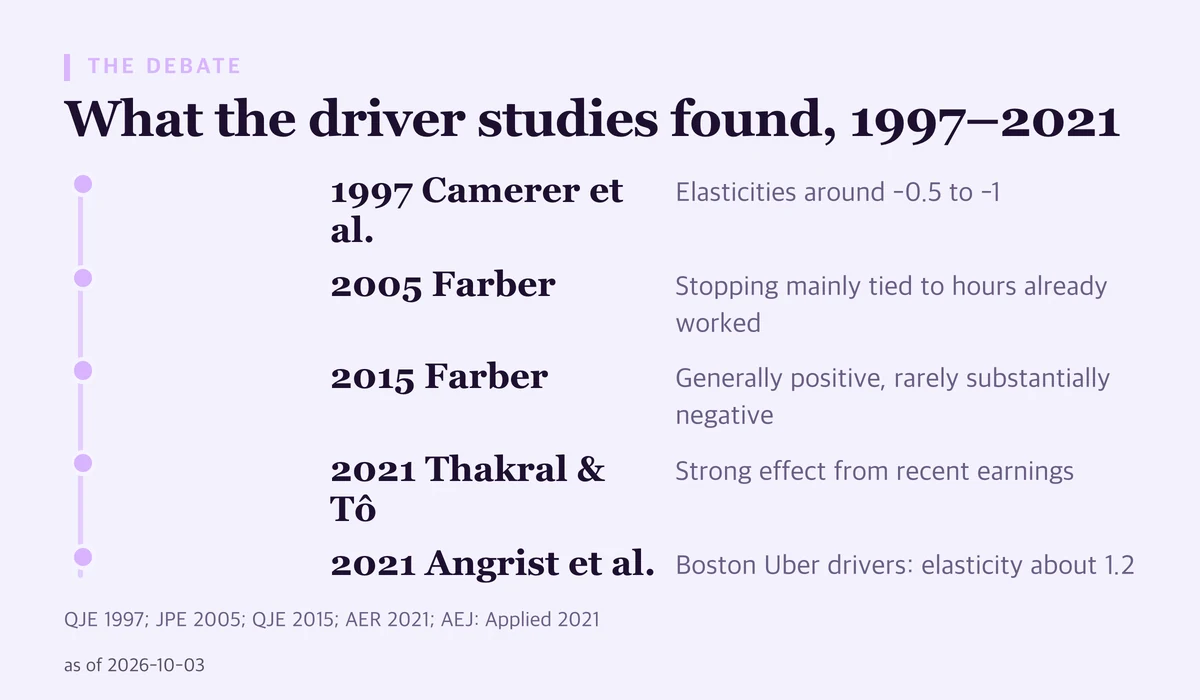
In 1997, Camerer, Babcock, Loewenstein and Thaler published a study of New York City cabdrivers in the Quarterly Journal of Economics. Across three different samples, they found the drivers’ wage elasticities were persistently negative, around -0.5 to -1.
In plain terms, on days when the hourly take was higher, drivers tended to work fewer hours. With those figures, a 10 percent better hourly rate went with roughly 5 to 10 percent fewer hours. Standard life-cycle models predict the opposite: more hours when pay is temporarily high. The authors read the result as drivers making their work decisions one day at a time, rather than shifting hours across days.
One way to read this: each day worked like its own small account, judged on its own result. Then the data got bigger.
In 2005, economist Henry Farber looked again at when New York cabdrivers stop for the day. He found daily income effects were small. Stopping was mainly related to the hours a driver had already worked on the shift. Cumulative income was weakly related at best.
In 2015, Farber used the complete record of New York taxi trips over several years. This time, drivers generally responded positively when earnings opportunities rose, with elasticities rarely substantially negative.
So was the 1997 story simply wrong? Not entirely. In 2021, Thakral and Tô found that cabdrivers work less when their accumulated income within a day is higher. Recent earnings have a strong effect, and it gradually fades for money earned earlier in the day. Their model has drivers working toward a reference point that adjusts, with a lag, when earnings run above or below expectations. In their reading, this reconciles the “neoclassical” and “behavioral” views of the daily evidence.
Ride-hailing data added another angle. Angrist, Caldwell and Hall offered random samples of Boston Uber drivers a virtual taxi medallion that removed the Uber fee. The drivers’ response revealed an intertemporal substitution elasticity on the order of 1.2. Roughly, 10 percent better pay went with about 12 percent more work. In that setting, drivers worked more when pay was higher, much as standard models predict.
Three ways the window shapes your money
First: Pick the window before you read the number
A money window is the stretch of time you use to decide whether you did well. Say you walk dogs for a living, with six walks on a sunny Saturday and two on a wet Wednesday. Judged day by day, Saturday is a win and Wednesday is a loss. Judged by the month, both are parts of one income. Choose your window first, and a single day’s number stops feeling like a verdict. It becomes one data point among many.
Second: When an hour pays more, pause before you coast
A high-value hour is one that pays more than your usual hour. Think of a rideshare driver near a stadium as a game lets out, or a contractor offered extra shifts in a busy season. A daily frame says, “That’s enough for today.” A longer frame asks, “Is this hour worth more than an hour next Tuesday?” Sometimes the honest answer is no, because you’re tired or the evening matters more. But asking means a good stretch gets weighed on its own terms, not cut short because a line was crossed.
The same window problem shows up in spending. A big paycheck can make a Friday dinner out feel free. Spread that paycheck across the month, and you can see how much of it is actually spare.
Third: The latest number is the loudest
Recent money speaks louder than older money. That is the within-day pattern Thakral and Tô describe. A sale that landed an hour ago can feel bigger than one from this morning. A charge that cleared yesterday can feel heavier than one from last month. What changes once you notice this? You start checking a running total — the week, the month — before you react to the latest number on your screen.
The other side
None of this shows that people are hopeless with money. The larger, later datasets — Farber’s full trip records and the Boston Uber experiment — generally found drivers working more when pay was higher. Where something like daily targeting shows up, it seems to fit some drivers and some hours, not everyone all the time. Even Thakral and Tô’s version uses a reference point that adjusts over time, not a fixed daily number.
Farber’s 2005 result points to a plainer explanation for when shifts end: hours already worked. One simple reading is fatigue. A long shift may end because of the body, not the running total.
There is a learning story, too. In Farber’s 2015 data, newer drivers with less responsive elasticities were more likely to leave the industry, and those who stayed learned to optimize better. So the narrow frame may fade with experience, or the drivers who keep it may move on.
The Uber study carries its own caution. Many drivers who would have come out ahead with the cheap lease chose to sit out. A deal that looks good on paper does not always get taken, and the reasons are not always visible from outside.
Finally, a short window is sometimes the right one. If rent is due on Friday, this week’s earnings really do matter more than the yearly average. The point is to notice which window you’re using, not to assume the longest one always wins.
Try this today
Pick one money number you’ll look at today. It could be your tips, a sales total, your card spending, or the hours you logged. Then do three small things.
- Write the number down, with the feeling it gave you: good day, bad day, enough, not enough.
- Put it in a bigger window. Note what it looks like as part of your usual week, then your month.
- Before you act on it — leaving early, staying late, buying something — check whether the same choice still makes sense judged by the week.
Try it for one day. Not forever. One day. You don’t have to believe the window matters yet. Just notice whether the number feels different when the frame gets wider.
The 1997 cab study, the larger trip records that followed, and the Boston Uber drivers don’t agree on everything. Read together, they suggest the frame is worth watching. A day, a paycheck, a year — the time frame you use to judge money can quietly shape how much you work, earn, and spend. Once you can see the window, you can choose it.