
At a glance
- A famous 1985 study called the hot hand an illusion; a 2018 paper proved its counting method was biased against finding one.
- Corrected, the original controlled shooting data showed an effect of about 13 percentage points, with a wide range of roughly 4 to 22.
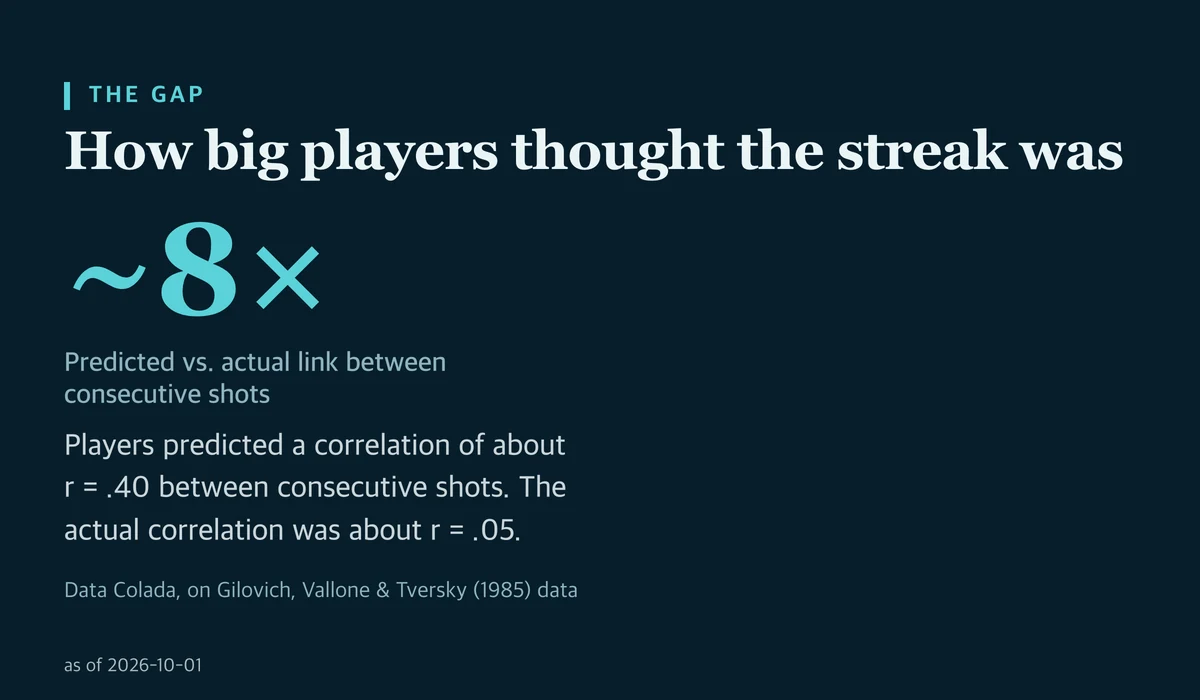
- The feeling still overshoots: players predicted a shot-to-shot correlation of about r = .40 when the actual one was about r = .05.
In this essay
Three good sales calls in a row, and by lunch you’ve decided the fourth one is a lock. You skip the prep. You quote a bigger number. You feel hot.
Basketball has a name for that feeling: the hot hand. For about three decades, a famous study said it was an illusion. Then two economists found a flaw in how streaks were counted, and the study’s conclusion reversed. But this is not a simple win for streaks. The hot hand looked real in some data, much smaller than people believe, and absent in other data.
The everyday mistake is collapsing all that into one answer. Either you ignore a good run, or you lean on it hard. By the end, you’ll understand why a streak is partly real and partly illusion, and how to use momentum without betting more on it than it’s worth.
Real weight, crooked scale
Picture a bathroom scale that reads a few pounds heavy. The weight on it is real. The number it shows is inflated. Throw the scale out, and you lose real information. Trust it blindly, and you plan around a body you don’t have.
A streak may work the same way. In some settings, there is something real under it. But the reading your gut gives you runs high. The useful move is learning roughly how far off it reads.
That’s the principle: momentum can be real while your sense of it is badly inflated. What follows is about the size of that gap, and where it holds.
The myth that wasn’t quite
In 1985, psychologists Thomas Gilovich, Robert Vallone and Amos Tversky published a paper in Cognitive Psychology that became a classic. They surveyed 100 basketball fans at Cornell and Stanford. Of those fans, 91% believed a player has a better chance of making a shot after hitting the last two or three than after missing them.
Then they checked real shots: NBA field-goal records, a controlled shooting study, and free-throw data. The link between one shot and the next came out essentially zero, or slightly negative. Their conclusion was that fans were seeing patterns in random sequences. The hot hand was a trick of the mind.
In a 2018 paper in Econometrica, economists Joshua Miller and Adam Sanjurjo proved something odd about that method. Take a finished, finite sequence and measure the hit rate right after a streak. The method itself pulls the estimate down. It does this even with a fair coin.
Why would a fair coin look streak-averse? The coin isn’t biased; the counting is. Picture a short list of flips already written down. Each time you pick a flip that follows a heads, that heads has used up one of the list’s limited heads. What’s left leans slightly toward tails. So a shooter with no hot hand would look a little cold, and a shooter who looks average might be warm.
Correcting for this changed the picture. As Data Colada lays out, the 1985 authors’ estimate in one of their datasets was about 3 percentage points, not statistically significant (p = .49). After the correction, Miller and Sanjurjo’s reanalysis of the original controlled shooting study put the effect at about 13 percentage points. The 95% confidence interval was wide, roughly 4 to 22 points.
We observe that the canonical study in the influential hot hand fallacy literature, along with replications, are vulnerable to the bias. Upon correcting for the bias we find that the long-standing conclusions of the canonical study are reversed.
They also hand-coded footage of the NBA’s Three-Point Contest. Among the 33 shooters with at least 100 contest shots, the bias-corrected hot-hand effect was about 8 percentage points. One way to read this: when someone repeats the same task under steady conditions, a modest run of form may be real.
Three ways to use a streak
First: spend momentum on volume, not stakes
When you’re on a run, do more of the same thing at the same size. Say the paragraphs are coming easily on a Tuesday morning. Keep writing past your usual stopping point. Don’t email the client promising the full draft by Thursday.
What changes is your downside. If the run is real, you bank extra pages. If it’s noise, you’ve spent an hour you would have spent working anyway.
Second: shrink the feeling before you act on it
Assume the edge you feel is bigger than the edge you have. In the 1985 data, players predicted a correlation of about r = .40 between consecutive shots. The actual correlation was about r = .05. Since .40 divided by .05 is 8, the guess was about eight times the real figure. Fans and players also expected free-throw accuracy to jump about 8 percentage points after a single make. The actual change was about 0 to 2 points.
Back to the sales calls. Three wins can tell you the pitch is working. They can’t tell you the fourth client has already said yes. Keep the confidence, and keep the prep. The feeling becomes a hint about direction, not a measure of size.
Third: check whether the conditions hold still
Give a run more credit when the task repeats under the same conditions. The clearest evidence for the hot hand comes from setups like that: a controlled shooting study and a televised shooting contest. In real games, as the next section shows, the picture changes.
In your week, steady conditions might mean reps at the gym or cold emails from a template. They probably don’t include a negotiation or a group-chat argument, where other people react to what you just did. What changes is where you spend your trust: a little on runs in steady tasks, much less elsewhere.
The other side
The strongest objection comes from real games. Researchers Lantis and Nesson studied 12 NBA regular seasons, from 2004–05 through 2015–16. For field goals, they found no hot hand. Making a shot did not make a player more likely to make the next one. Long streaks of makes actually lowered the odds of the next shot going in. They did find a small hot-hand effect for free throws, which more than doubled for longer streaks.
So the corrected hot hand from the shooting study and the contest has not been confirmed in ordinary in-game field goals. Even inside basketball, the idea that momentum is real doesn’t stretch cleanly across every setting.
Size matters too. An effect of about 13 points, with an interval from roughly 4 to 22, is real but uncertain. And notice what survived the correction. The claim that no hot hand exists did not. The claim that people overestimate streaks did. Those r = .40 guesses still sit beside an r = .05 reality.
Then there is everything outside sports. None of this research tested sales calls, writing sessions or workouts. Applying it to your Tuesday is a reasonable guess, not a finding. Even one of the original authors sounds unsettled about the math:
People with tremendous math skills are all over the map on this one. I simply say that because the mathematicians I talk to are befuddled about the proper statistical analysis. Time will have to tell on that one.
Try this today
Pick one task you’ll repeat several times today: calls, emails, sets at the gym, pages of a draft.
- When you notice a run of good ones, pause for ten seconds. Write on a sticky note how likely you think the next one is to go well.
- Do the next one at the same size. Same prep, same promise, same stakes.
- Tonight, check the note against what actually happened.
Try it for one day. Not forever. One day. You may find the run was real. You may also find your guess ran well ahead of it.
That gap is the whole story. A streak is partly real: corrected math found a hot hand in data where a famous study saw none. It is also partly illusion: the feeling runs far ahead of the effect, and in real NBA games it didn’t show up for field goals at all. So let a good run carry you into more of the work. Just don’t bet more on it than it’s worth.