
At a glance
- In the 2000 jam study, 60% of passersby stopped at a 24-jam display vs 40% at a 6-jam one; of those who stopped, about 3% vs almost 30% bought.
- A 2010 review of 50 experiments (63 conditions, N = 5,036) found an average effect of more options near zero, with wide differences between studies.
- A 2015 meta-analysis (99 observations, N = 7,202) linked overload to four conditions: complex options, hard tasks, unclear preferences and an effort-minimizing goal.
In this essay
Too many options, and people freeze. You have felt it in a wall of browser tabs comparing running shoes, or a streaming menu scrolled until the evening was gone. And there is a famous study to back the feeling: a table of 24 jams that almost nobody bought from. The lesson seems settled. Cut the choices and the decision will come. Yet that study counted something narrower than the slogan it became, and the research since has been less tidy. What did the jam table actually measure, why did a review of 50 experiments find an average effect close to zero, and which conditions mark the cases where more options really do stall a choice?
One table, two Saturdays
The study is Iyengar and Lepper’s 2000 paper, “When Choice Is Demotivating”, in the Journal of Personality and Social Psychology. Its best-known part took place in an upmarket grocery store. On two Saturdays, the researchers ran a jam-tasting display holding either 6 jams or 24. Shoppers who came over to taste got a $1 discount coupon.
The first result rarely makes the retelling. Of the people walking past, 60% stopped at the 24-jam display, against 40% at the 6-jam one. The bigger table drew the bigger crowd.
The famous figures cover a narrower group: shoppers who stopped. Among them, about 3% bought jam after the 24-jam table, against almost 30% after the 6-jam table. Those are the figures as commonly reported, for example in Jason Collins’s critique of how the study gets cited, and the retellings rarely give sample sizes.
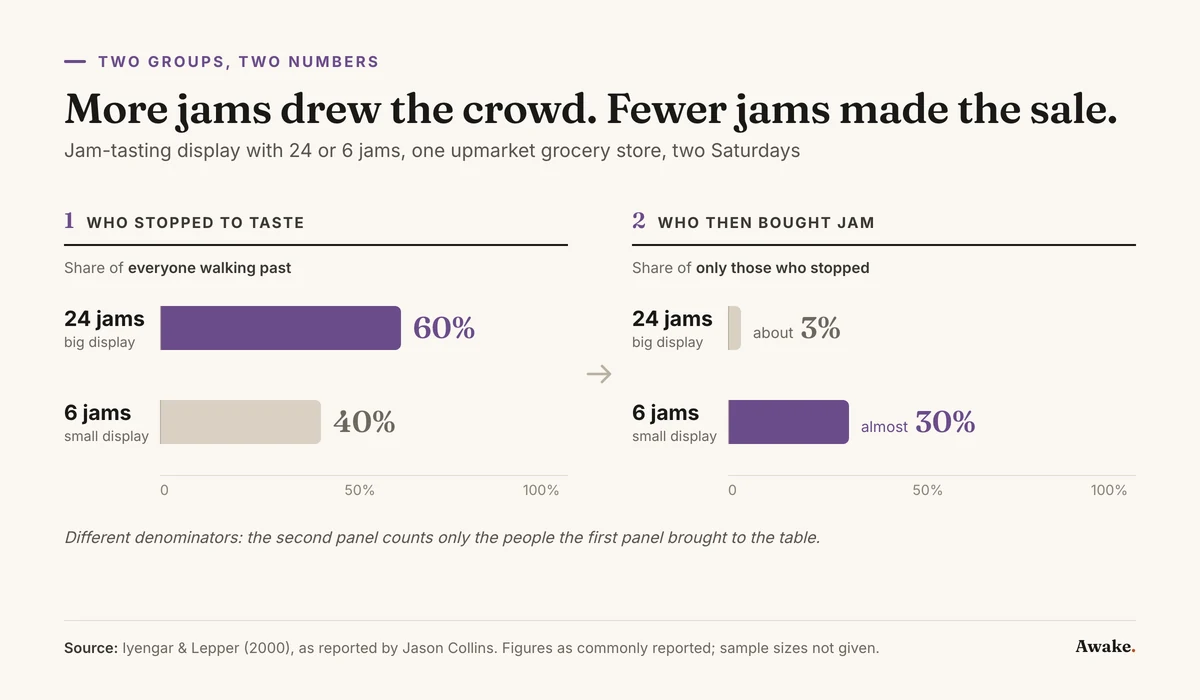
The finding, then, describes one store, two Saturdays and people who had already walked up to taste. It cannot say what the passersby did later, how other stores would compare, or whether anyone came back for jam the following week.
The same paper ran two more experiments. Students in an introductory social psychology class picked an extra-credit essay topic from 6 or 30. Others picked a chocolate from 6 or 30. Those facing 30 chocolates enjoyed choosing more, yet reported more dissatisfaction and regret, and were less likely to take chocolate rather than money as payment.
Fifty experiments, one average
A decade later, Scheibehenne, Greifeneder and Todd gathered published and unpublished experiments on the same question. Their 2010 meta-analysis in the Journal of Consumer Research covered 63 conditions from 50 experiments, with 5,036 participants. The average effect of more options was virtually zero, and the spread between studies was wide.
Close to zero on average is not the same as nothing. Earlier studies had found strong overload, no overload, and sometimes a benefit from more options; pooled, they largely cancel. The authors identified several possible preconditions for overload but no sufficient one, nothing that reliably produced it whenever present.
Jam itself did not travel cleanly. A jam experiment in an upscale German supermarket found no effect of the number of options, and chocolate and jelly-bean experiments found none either. Their designs differed from the original, so they do not overturn it on their own.
Set the two scenes next to each other. At one tasting table, far fewer of the shoppers who stopped bought from the bigger assortment. Across 50 experiments, assortment size did almost nothing on average. If both hold, the count of jars cannot be the whole story. What else was going on at that table?
Four conditions that travel with overload
In 2015, Chernev, Böckenholt and Goodman went looking in a second meta-analysis, published in the Journal of Consumer Psychology (pp. 333–358). Pooling 99 observations with 7,202 participants, they asked when overload appears rather than whether. Four moderators stood out:
- Choice set complexity: how hard the options are to compare.
- Decision task difficulty: how demanding the act of choosing is.
- Preference uncertainty: how unclear you are about what you want.
- Decision goal: what you want out of the choice.
Higher levels of each went with more overload, and a goal of minimizing effort was especially influential. Once all four were in the model, the overall effect of assortment size was significant, a reading that contradicts the 2010 average.
The review also compared four common ways of measuring overload: lower satisfaction or confidence, regret, putting the choice off, and readiness to switch. They worked about equally well. Have you ever put off a purchase for weeks, then regretted it once it was made? By this account, those may be one strain felt at two moments.
Each condition has an everyday shape. A phone plan where every tier mixes data, minutes and contract length differently is complex. An apartment search when you can’t say whether space or commute matters more is preference uncertainty. Choosing dinner at the end of a long day, when you only want it settled, is an effort-minimizing goal.
Now look back at the jam table with that list. Nobody recorded what the shoppers wanted, but someone on a Saturday errand, asked to settle on one jar, may well have had no favorite flavor in mind and little wish to work at it. Twenty-four was simply the part of that table anyone could count.
Putting it to work
Take the decision you keep putting off: the phone plan, the sofa, the course bookmarked a month ago. Before you trim the list, check it against those four conditions.
Start with preference. Before you open another tab, write one line naming what matters most: quiet street, short commute, no annual contract. If the line won’t come, learning what you want is the first job, and the list can wait.
Then name the goal. If you mostly want this over with, admit it, and decide now that the first option meeting your line wins.
If the options still blur together, choose the two features you care about and compare only those.
None of these steps was tested in the studies above. They aim at the conditions the 2015 review linked to overload rather than at the length of the list. If the choice still stalls after that, cutting options is a fair next move.
The case against
This essay leans on the 2015 review, and the lean deserves scrutiny. The two meta-analyses disagree in framing, and they pooled different sets of studies, so neither settles the question alone. Both summarize patterns across studies that differ in products, settings and measures. They show when overload tends to appear. They do not show that changing those conditions, or cutting options, causes better decisions, which leaves the steps above a reasonable inference rather than a proven method.
The opposite slogan fails as well. Calling choice overload a myth misreads an average that contained strong effects, and it ignores the 2015 result. Large assortments also have a real upside: at the jam table, the bigger display pulled in more of the people walking past. A shop or menu that trims its range to spare customers could lose some of the interest the range created.
What the jam table measured was narrow: how many shoppers who stopped at one tasting display, over two Saturdays, went on to buy. Across 50 experiments, studies pulled in opposite directions and the average sat near zero. Where overload did gather, it came with complex options, hard choices, unclear preferences and a wish to be done.
When a choice stalls, the length of the list is the easiest thing to blame. Check first whether you know what you want.