At a glance
- In 66,465 U.S. discount-broker households (1991–96), the fifth that traded most earned 11.4% a year net; the market returned 17.9%.
- In an earlier version of the study, the average household's stocks kept pace with the market before costs (17.7% vs 17.1%) but earned 15.3% after them.
- The data come from one broker in a 1990s bull market with high commissions; they show an association, not that any single trade was a mistake.
In this essay
The brokerage app is open before the kettle has boiled. One holding has slipped all week, another has climbed, and the sell button sits right under your thumb. Moving money around feels like care. Leaving it alone feels closer to neglect, like driving past a warning light on the dashboard. If you think of yourself as a responsible investor, your proof is activity: reading, trimming, adding, adjusting.
Two finance researchers, Brad Barber and Terrance Odean, found a way to test that feeling against real money. They studied the account records of 66,465 households at a large U.S. discount broker from 1991 to 1996. Their data can answer a plain question. When ordinary people traded more, did they end up with more, and if not, where did the difference go?
The households that never sat still
Barber and Odean sorted those households by how much they traded, then compared what each group earned. The results appeared in the Journal of Finance in 2000, under a title that leaves little suspense: “Trading Is Hazardous to Your Wealth.”
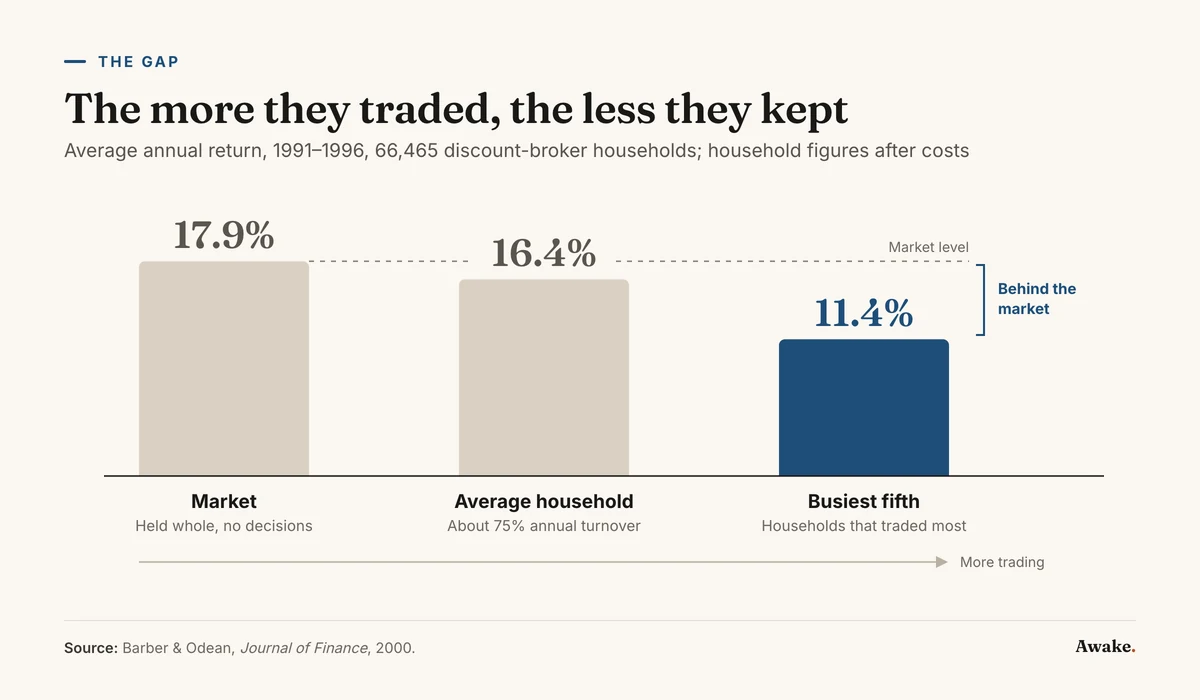
The fifth of households that traded most earned 11.4% a year after costs. Over the same years, the market returned 17.9%. These were not exotic bets. The sample covers ordinary common stocks that households held directly in ordinary brokerage accounts, and the busiest of those households worked their accounts hard. If you have ever sold a stock after one bad week, their habits may look familiar.
The average household was busy too, just less so. It earned 16.4% a year net and turned over about 75% of its portfolio annually. Put plainly, in a typical year it sold and replaced holdings worth roughly three-quarters of everything it owned.
What the records capture is the trail in each account: what was bought, what was sold, what was left. They do not capture why anyone clicked. A household in the busiest group might have been reacting to headlines, a friend’s tip or a bad week. The study measures the decisions, not the reasoning behind them.
The account that made no decisions
Now set those households beside a participant that did nothing at all. The market’s 17.9% is roughly what you would have earned by holding the whole market and touching none of it, before any fund fees. No research, no timing, no second-guessing on a Sunday night.
Line up the three results and you can see a slope. The account with no decisions finished first. The average household, trading at a moderate pace, finished below it. The households that traded most finished furthest behind. In this sample, more activity went with less money at each step shown.
So where did the difference go? The obvious suspect is bad stock picks. An earlier working-paper version of the same study, posted on Odean’s faculty page, points somewhere else. In that version, the average household’s stocks returned 17.7% a year before trading costs, against 17.1% for the market. The authors described that gross performance as unremarkable.
After costs, the same average household in that version earned 15.3%. Before costs, its picks had kept pace with the market and even edged past it. The shortfall opened in the space between deciding and doing: the cost of each buy and each sell.
Two cautions belong here. The working paper uses a somewhat different sample from the published article, so its figures should not be blended with the ones above. And the published figures we could check do not split the busiest group’s shortfall into picks and costs. The clearest sign that costs did the damage comes from the average household in the earlier version.
Why the busy hands cost more
Every trade carries a price. In the 1990s that meant a commission on each order. There is also the spread: when you buy, you pay the higher of two quoted prices, and when you sell, you get the lower one. One trade’s cost is easy to shrug off. An account that turns over most of its holdings each year pays it again and again. None of those trades has to be a bad pick for the total to grow.
That explains the mechanics. It does not explain the urge. Why would anyone keep paying for moves that, on average, did not beat standing still? Barber and Odean’s answer is overconfidence: investors believing their information and judgment are better than they are. That is the authors’ reading of the pattern. Account records cannot test the confidence of any one investor.
They pressed the idea further in a follow-up, “Boys Will Be Boys,” published in the Quarterly Journal of Economics in 2001. With a different sample, over 35,000 households at a large discount brokerage from February 1991 to January 1997, they compared men and women. Men traded 45% more than women. Trading cut men’s net returns by 2.65 percentage points a year, against 1.72 points for women. Both groups paid for activity. The group that traded more paid more.
Go back to the kettle and the sell button. In these accounts, attention was billed by the trade. The households that gave their money the most of it finished furthest from what sitting still would have paid.
Start here
Open your brokerage app and find the transaction history, not the performance screen. Count the buys and sells from the last twelve months. Each one probably felt like a single, reasonable decision when you made it. The count shows them together.
Beside each trade, write the reason in a few words. Some reasons will hold up: rebalancing back to a mix you chose on purpose, or a sale made for tax reasons. Others may read like “it dropped all week” or “everyone was talking about it.” The study cannot tell you which of your trades were mistakes. Your list can show you which ones you can still explain.
Before the next trade, type one line into the notes on your phone: what do I know about this stock that the person on the other side of the trade does not? If no answer comes, nothing requires the trade to happen today. You can close the app and look again tomorrow, or leave it closed.
Where this breaks down
The limits here are real, and they matter if you are reading this study today. The data come from one discount broker between 1991 and 1996, a strong bull market in which the market itself returned 17.9% a year. Commissions then were far higher than on today’s zero-commission apps, so each trade cost more than it does for many investors now.
The findings are also an association across households. Busier accounts did worse on average, but that does not mean any particular trade was a mistake. If you rebalance once a year or sell for tax reasons, you have a purpose the averages do not see. The numbers also depend on the version. The working paper and the published article report somewhat different samples and returns, so this piece uses the published figures except where it says otherwise.
Cheap trading has not made every cost vanish, though. In a 2009 study in the Review of Financial Studies, Barber, Odean and two colleagues used the complete trading records of all investors in Taiwan. The aggregate portfolio of individual investors underperformed by about 3.8 percentage points a year, roughly 2.2% of Taiwan’s GDP. Nearly all of the losses came from aggressive orders, while institutions gained about 1.5 points a year.
Taiwan in 1995 to 1999 had far higher turnover and transaction taxes than the U.S. today, so that figure should not be applied to an American investor now. It does show that spreads, timing and haste can cost money when the commission line reads zero.
Within those 66,465 households, the pattern ran one way. Across the paper’s groups, more trading went with lower returns, and the earlier version traces the average household’s gap to costs rather than picks. The busiest fifth were the most involved with their money, and they finished the period at 11.4% a year.